From A Bunch of Idiots and Their Adventures Through Space
Jump to navigation
Jump to search
|
| Rational subgroup size | {{{subgroupsize}}} |
|---|
| Measurement type | {{{measurementtype}}} |
|---|
| Quality characteristic type | {{{qualitycharacteristictype}}} |
|---|
| Underlying distribution | {{{distribution}}} |
|---|
|
|
| Not applicable |
|
Infobox for control charts.
Usage
Copy-paste this empty template. Explanations of the parameters is given below
{{Infobox control chart
| name =
| proposer =
<!-----Process observations----->
| subgroupsize =
| measurementtype =
| qualitycharacteristictype =
| distribution =
<!---------Performance---------->
| sizeofshift =
| arl =
<!---Process variation chart--->
| varchart =
| varcenter =
| varupperlimit =
| varlowerlimit =
| varstatistic =
<!------Process mean chart------>
| meanchart =
| meancenter =
| meanlimits =
| meanupperlimit =
| meanlowerlimit =
| meanstatistic =
}}
Parameter descriptions
| Parameter |
Required? |
Default value |
Conditional upon |
Description
|
| name |
No |
{{PAGENAME}} |
None |
The name of the chart
|
| proposer |
No |
None |
None |
The person who originally proposed the chart
|
| subgroupsize |
Yes |
None |
None |
The size of the rational subgroup being monitored
|
| measurementtype |
Yes |
None |
None |
What is being measured (quality characteristic directly, proportion, count, etc.)
|
| qualitycharacteristictype |
Yes |
None |
None |
Attributes or variables data
|
| distribution |
Yes |
None |
None |
Probability distribution of the quality characteristic
|
| sizeofshift |
No |
None |
None |
Minimum size of the shift in the quality characteristic that the chart can detect
|
| arl |
No |
None |
None |
Average run length
|
| varchart |
No |
None |
None |
Image file depicting control chart for variability
|
| varcenter |
No |
None |
None |
How to compute the variability control chart center line
|
| varupperlimit |
No |
None |
None |
How to compute the variability control chart upper limit
|
| varlowerlimit |
No |
None |
None |
How to compute the variability control chart lower limit
|
| varstatistic |
No |
None |
None |
How to compute the individual points on the variability control chart
|
| meanchart |
No |
None |
None |
Image file depicting control chart for the mean
|
| meancenter |
No |
None |
None |
How to compute the mean control chart center line
|
| meanlimits |
No |
None |
None |
How to compute the mean control chart limits (if limits are symmetric)
|
| meanupperlimit |
No |
None |
!{{meanlimits}} |
How to compute the mean control chart upper limit (if limits are asymmetric)
|
| meanlowerlimit |
No |
None |
!{{meanlimits}} |
How to compute the mean control chart lower limit (if limits are asymmetric)
|
| meanstatistic |
No |
None |
None |
How to compute the individual points on the mean control chart
|
Example
| np-chart |
|---|
| Originally proposed by | Walter A. Shewhart |
|---|
|
| Rational subgroup size | n > 1 |
|---|
| Measurement type | Fraction nonconforming per unit |
|---|
| Quality characteristic type | Attributes data |
|---|
| Underlying distribution | Binomial distribution |
|---|
|
| Size of shift to detect | ≥ 1.5σ |
|---|
| Average run length (ARL) | Unknown |
|---|
|
| Not applicable |
|
| File:Np control chart.svg |
| Center line | 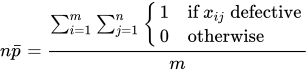 |
|---|
| Control limits | 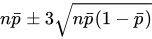 |
|---|
| Plotted statistic | 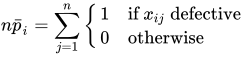 |
|---|
{{Infobox control chart
| name =            np-chart
| proposer =        [[Walter A. Shewhart]]
| subgroupsize =    n > 1
| measurementtype = Fraction nonconforming per unit
| qualitycharacteristictype = Attributes data
| distribution =    [[Binomial distribution]]
| sizeofshift =     ≥ 1.5σ
| arl =             Unknown
| meanchart =       Np control chart.svg
| meancenter =      <math>n \bar p = \frac {\sum_{i=1}^m \sum_{j=1}^n \begin{cases} 1 & \mbox{if }x_{ij}\mbox{ defective} \\ 0 & \mbox{otherwise} \end{cases}}{m}</math>
| meanlimits =      <math>n \bar p \pm 3\sqrt{n \bar p(1- \bar p)}</math>
| meanstatistic =   <math>n \bar p_i = \sum_{j=1}^n \begin{cases} 1 & \mbox{if }x_{ij}\mbox{ defective} \\ 0 & \mbox{otherwise} \end{cases}</math>
}}
 Template documentation